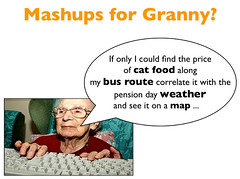
 Since Larry Clarkin and I wrote the Enterprise Mashups article in the Architecture Journal, I’ve been getting a ton of questions about mashups and what they are. To that end, I thought I’d put my neck out and lay down a public definition.
A mashup is an application that pulls together data from different sources and puts that with functionality that didn’t know about each other previously to provide a interesting graphical look at that data.
Often, a mashup is used to the end of making decisions based on a visualization of the data.
The canonical example is putting data on a map. For example, Wikipedia (at least as of when I wrote this) defines it as follows:
In technology, a mashup is a web application that combines data from more than one source into a single integrated tool; an example is the use of cartographic data from Google Maps to add location information to real-estate data from Craigslist, thereby creating a new and distinct web service that was not originally provided by either source.
Mashup (web application hybrid) – Wikipedia, the free encyclopedia
However, it doesn’t have to be a map. It could be a graph, chart, mind map or any number of different overlays.
Now, notice that I didn’t talk about any given UI technology in my description. It could be AJAX. It could be Silverlight or Flex/Flash. It could be Java Applets. I’m not concerned about the exact technologies involved – just the overall idea that you are pulling together data with functionality with a UI none of which knew about each other before your “glue” code put them in the same room and let them dance.
Composite applications are not mashups. This is actually a funny one. Mashups are, by and large, composite applications. You can equate it to inheritance. Mashups have an IsA relationship with Composite Applications. However, the composite application that simply pulls together a number of different widgets each completely independent of the others on the page is not a mashup. So, what I’m saying here is that CAB Smart Parts, Sharepoint web parts and Java Portlets are not mashups – they are simply part of an overall application that has been assembled.
Aggregations are not mashups. I’ve been asked several times if aggregating 2+ RSS feeds or simply combining different data sources is a mashup. The reality is that it’s not.
If, on the other hand, you were pulling in 1+ RSS feeds and/or data sources and laying those out on a timeline or some different view of the data than just an aggregated list – then we are probably talking about a mashup. The key part here is that we are doing something more with the data than adding it together. We are enabling decisions to be made based on that data.
Tools to build mashups
You don’t actually need tooling to build a mashup. You could create it from scratch with a little bit of Javascript and a chart control. The most common mashup, as stated in the canonical example above, is a map with geographical data laid on it. Both Google Maps and Live Maps have SDKs that you can build on top of. Actually, the Live Map SDK has a completely interactive documentation set as you can play with that will let you try different things and copy source code right into your own applications. In a lot of ways, you can look at these maps as not only applications but mashup platforms.
Popfly and Yahoo! Pipes
Then there are more complete frameworks and platforms that will help you build mashups such as Popfly and and Yahoo! Pipes. These platforms allow you to drag and drop different data sources and apply logic and ultimately run that through a front end visualization. My 12 year old son has played with Popfly and created mashups with ease. Denny Boynton wrote a great post entitled “Is the Future of Popfly in the Enterprise?“. I think that he’s got something there.
One of the interesting parts about Yahoo! Pipes is that it allows you to pull in your data, build out your functionality and then at the end you produce it and have a tabbed view with a different visualization on each tab. That’s cool! If your data is geo tagged, then it will give you a map view. If you have numeric data, it will show you charts and so on.
Where to get started
There are a couple of ways to get started playing with mashups. First, you can take a look at Popfly and the like. Or you could get started with one of the online mapping applications/mashup platforms. However, if you are serious about mashups in your own company and want to produce mashups with your own data – you need to start by taking a long and hard look at your SOA strategy.
Are all of your services written because you needed to move the client to a different machine? Often you can tell these because they start to resemble your table names and fall into Ron Jacob‘s CRUDy Web Service Anti-Pattern. Unfortunately, this is the vast majority of applications that I’ve seen in the world that use web services. It’s just using web services rather than truly service enabling your platform.
Or are they strategically built services that encapsulate business logic? Are you thinking about your authentication and authorization strategies? Are you thinking about SOAP verses REST? Can you produce either from your platform?
These are all decisions that need to be made before you decide on the UI technology.
